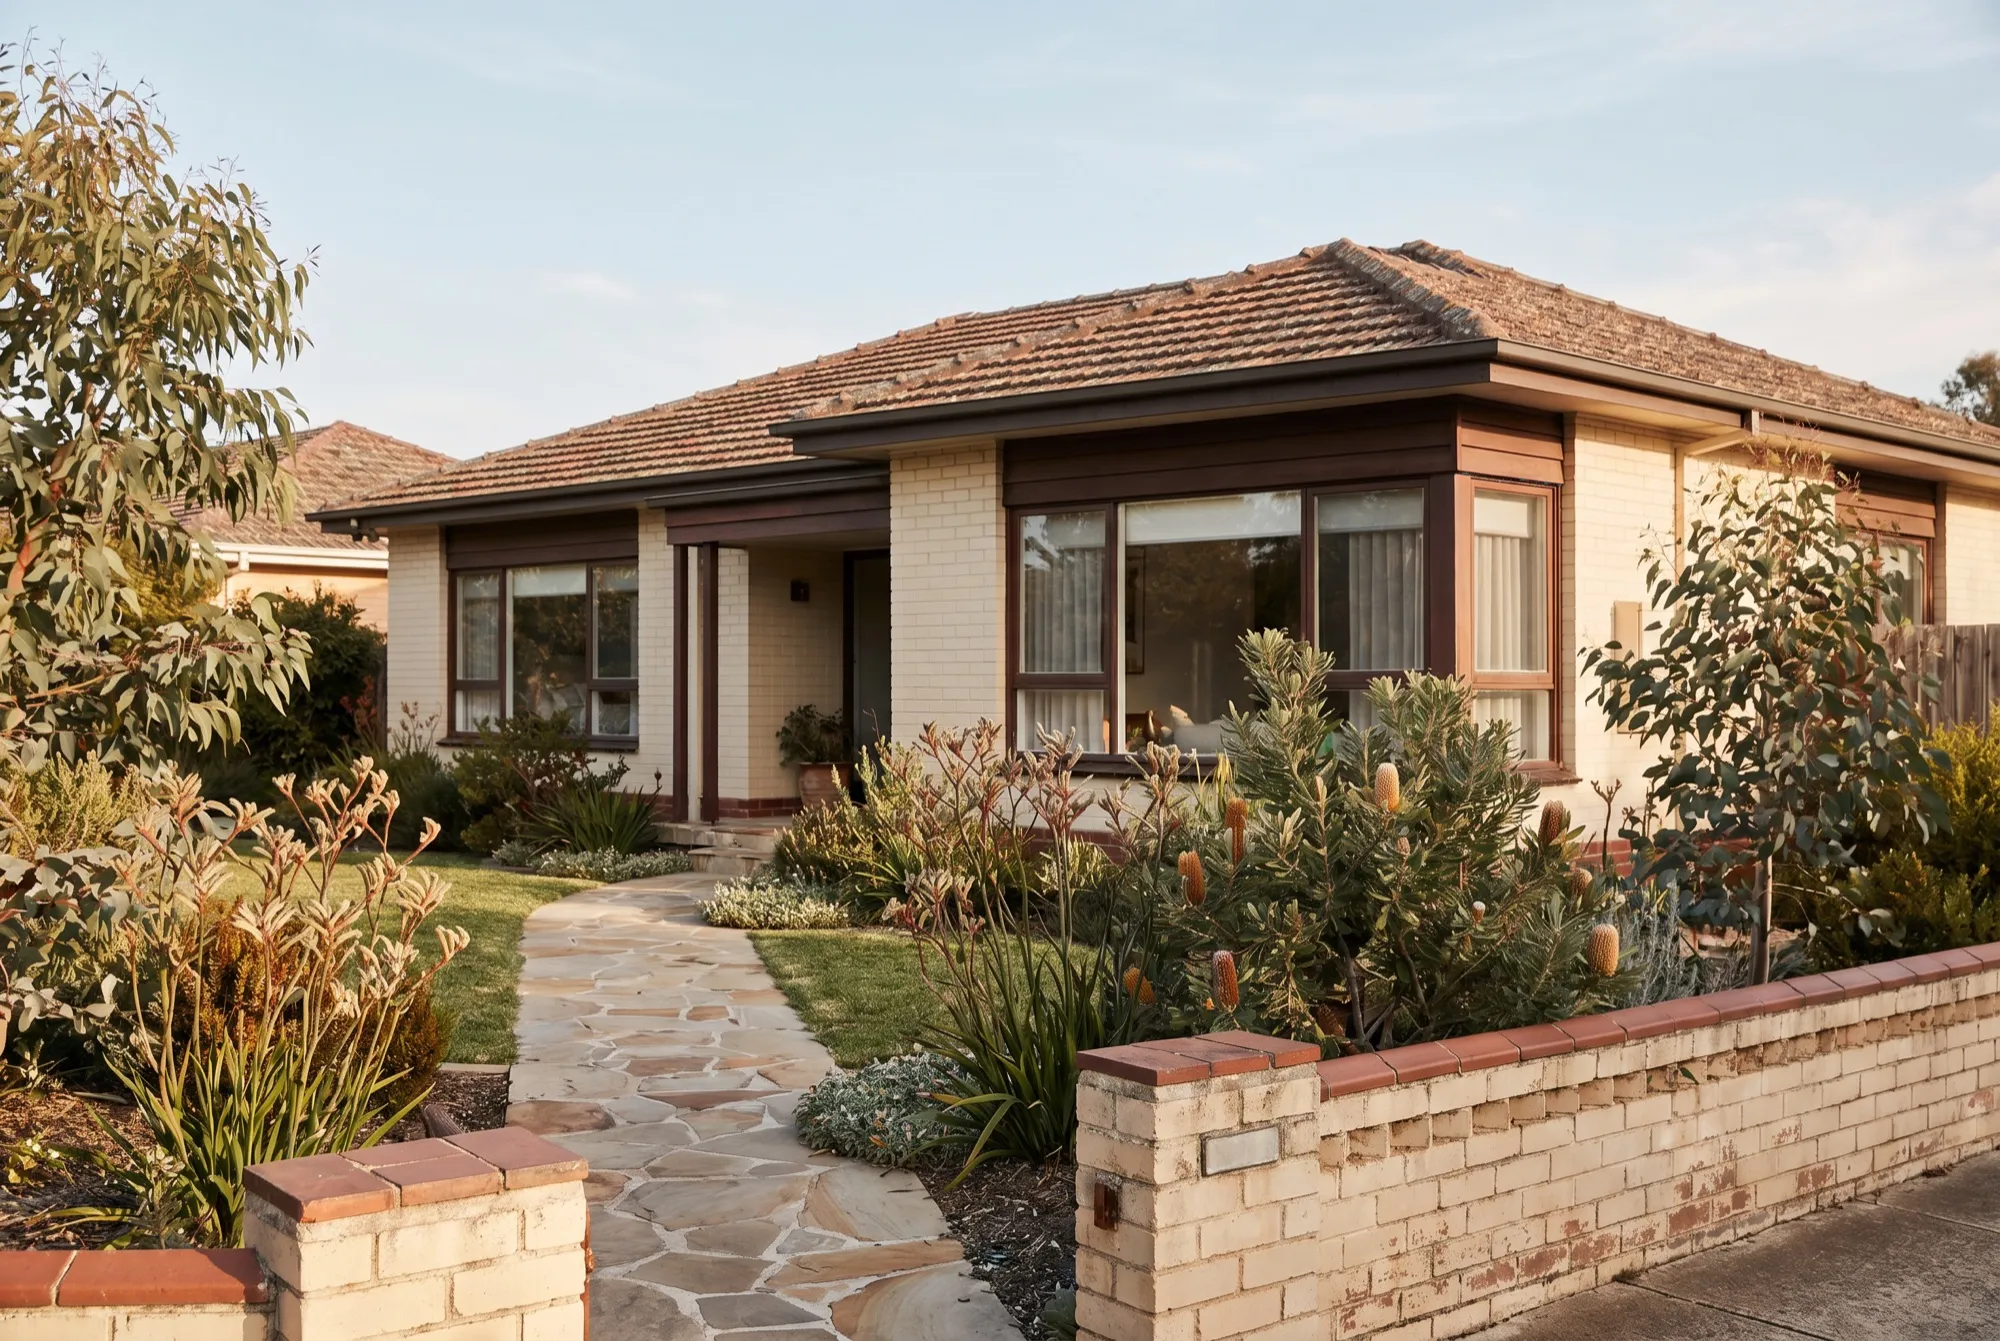
Australian house prices fell in June 2026, with national dwelling values down 0.4% for the month, according to Cotality’s Home Value Index. That is the steepest monthly decline in about three and a half years, and it was driven almost entirely by Sydney and Melbourne, where values dropped 1.2% and 1.0% respectively.
It is a genuine shift in tone after a long run of gains, but it is not a crash, and it is not happening everywhere. The headline number hides a market that is pulling apart, with the two biggest capitals sliding while several smaller cities keep grinding higher. Here is what the latest figures say, what is behind them, and what they do and do not mean if you own or want to buy.
What the June 2026 numbers show
The national fall of 0.4% for the month sounds small, and in isolation it is. The bigger story is the direction and the concentration. On a quarterly basis, capital city values fell around 1.3% over the June quarter, led by Sydney at roughly -3.2% and Melbourne at about -2.6%. Both cities are now down from their late-2025 peaks.
The mid-sized capitals tell a different story. Adelaide was broadly flat over the month, Brisbane edged up around 0.3%, and Perth rose roughly 0.7%. So while the national line points down, that is largely the weight of Sydney and Melbourne dragging the average, rather than a uniform slide across the country.
One more figure worth holding onto for perspective: despite the monthly setback, national values in June were still about 7.3% higher than a year earlier. Prices easing off a record is a very different thing from prices collapsing.
Why prices are cooling now
A few forces are pushing in the same direction. Borrowing costs are still elevated, with the RBA cash rate held at 4.35% through the first half of 2026, which keeps a lid on how much buyers can borrow and therefore what they can bid. Affordability in Sydney and Melbourne was already stretched after years of growth, so those markets had the least room left to run.
There is also a demand-side squeeze specific to investors, as changes affecting property investors landed around the start of the new financial year. When investor appetite softens and stock on the market rises at the same time, the balance tips toward buyers, and price growth stalls or reverses. Auction clearance rates in the big two capitals have drifted lower, which is usually an early sign that sellers are meeting the market rather than setting it.
A falling national average is often just the biggest cities cooling while the rest of the country quietly keeps moving in its own direction.
None of this is a forecast. Markets can turn again quickly if rates move or sentiment shifts, and short monthly figures are noisy by nature. Treat a single month as a data point, not a trend you can bank on.
What it means if you own
If you own in Sydney or Melbourne, a soft patch on paper does not change much unless you are about to sell. Values move up and down over any holding period, and a dip from a record high still leaves most long-term owners well ahead of where they bought. The number that matters is your equity position and your ability to keep meeting repayments, not the monthly index print.
If you are carrying a mortgage, the more useful lever right now is your interest rate, not the market. A cooling market does nothing for your monthly cash flow, but a sharper loan does. It is worth taking a moment to check whether your home loan rate still stacks up against what is currently on offer, because that is money you can actually control. Our guide to the median house price in Australia puts the current figures in longer-term context if you want to see how far the market has come.
What it means if you want to buy
For buyers, a cooling market is not automatically a green light. Lower prices in Sydney and Melbourne can widen your options, but higher interest rates mean your borrowing power is smaller than it would have been in a cheaper-money era, so the two partly cancel out. The right question is not whether prices are falling, but whether the repayments on a place you actually want are comfortable at today’s rates.
It also pays to remember the market is regional. A national headline about falling prices means little if you are buying in Perth or Brisbane, where values were still edging up in June. Look at the suburb and city you are targeting, not the country. If you are weighing up a purchase, our guide to buying property in Australia walks through the deposit, the costs and the checks before you commit.
Where to confirm the figures
Property data moves monthly and gets revised, so treat every number here as a snapshot rather than a fixed truth. The figures in this article, including the 0.4% monthly fall and the city-by-city moves, are drawn from Cotality’s Home Value Index for June 2026 and were last checked in July 2026. For the latest release and any revisions, check the source directly at Cotality. For the current cash rate and the next board meeting, the Reserve Bank of Australia is the primary source.
This article is general information only and is not personal financial, tax or legal advice. Your property, loan and local market will differ, so consider getting advice tailored to your situation before making a decision.
The bottom line
Australian house prices fell 0.4% in June 2026, the sharpest monthly drop in three and a half years, but the decline is concentrated in Sydney and Melbourne while Perth, Brisbane and Adelaide are holding up or still rising. For owners, a monthly dip off a record high changes little day to day. For buyers, cheaper prices are partly offset by higher borrowing costs, and the only market that really matters is the one you are actually buying in. Read the national headline as background, then look hard at your own city, your own rate and your own numbers.